AI stock chart analysis for iPhoneRead any chart
in seconds.
Upload a screenshot from any broker or charting app and get a clear plan: buy, sell or wait, with the entry, target and stop.
Download on the App Store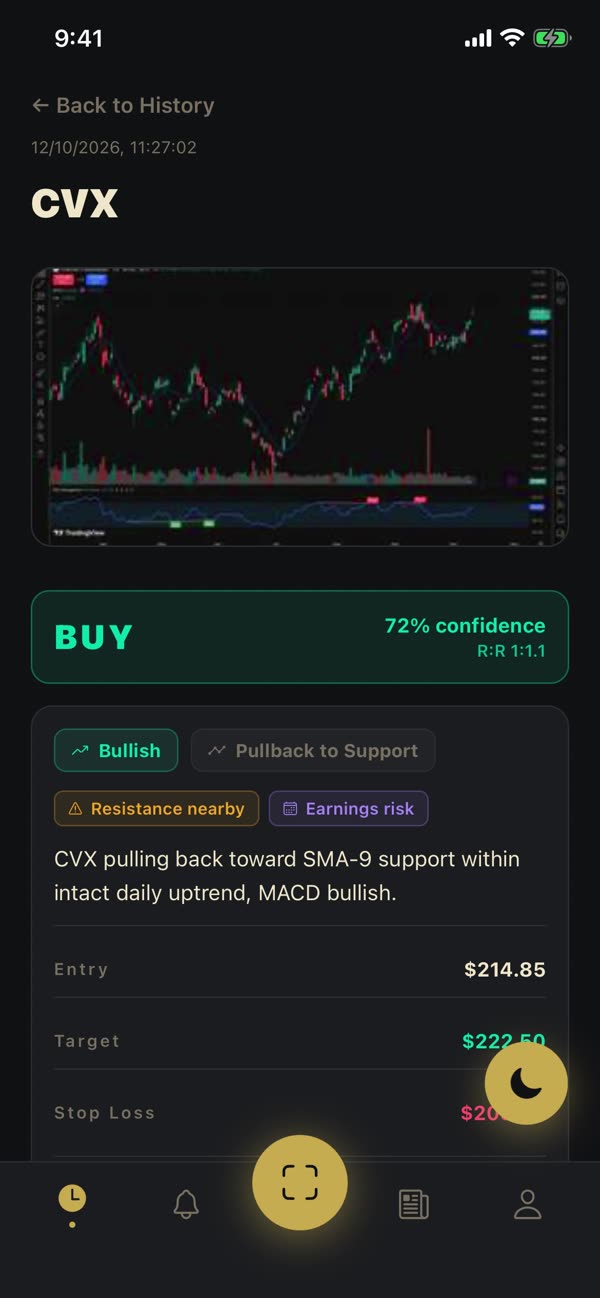
A plan you can act on.
A clear Buy, Sell or Wait verdict with a confidence score, the entry, target and stop-loss to act on, and exactly what would prove the setup wrong.
A real analysis from the app. Illustrative only.
- Scanned every weekday at the open
- Pushed straight to your phone
- Built for swing and long-term
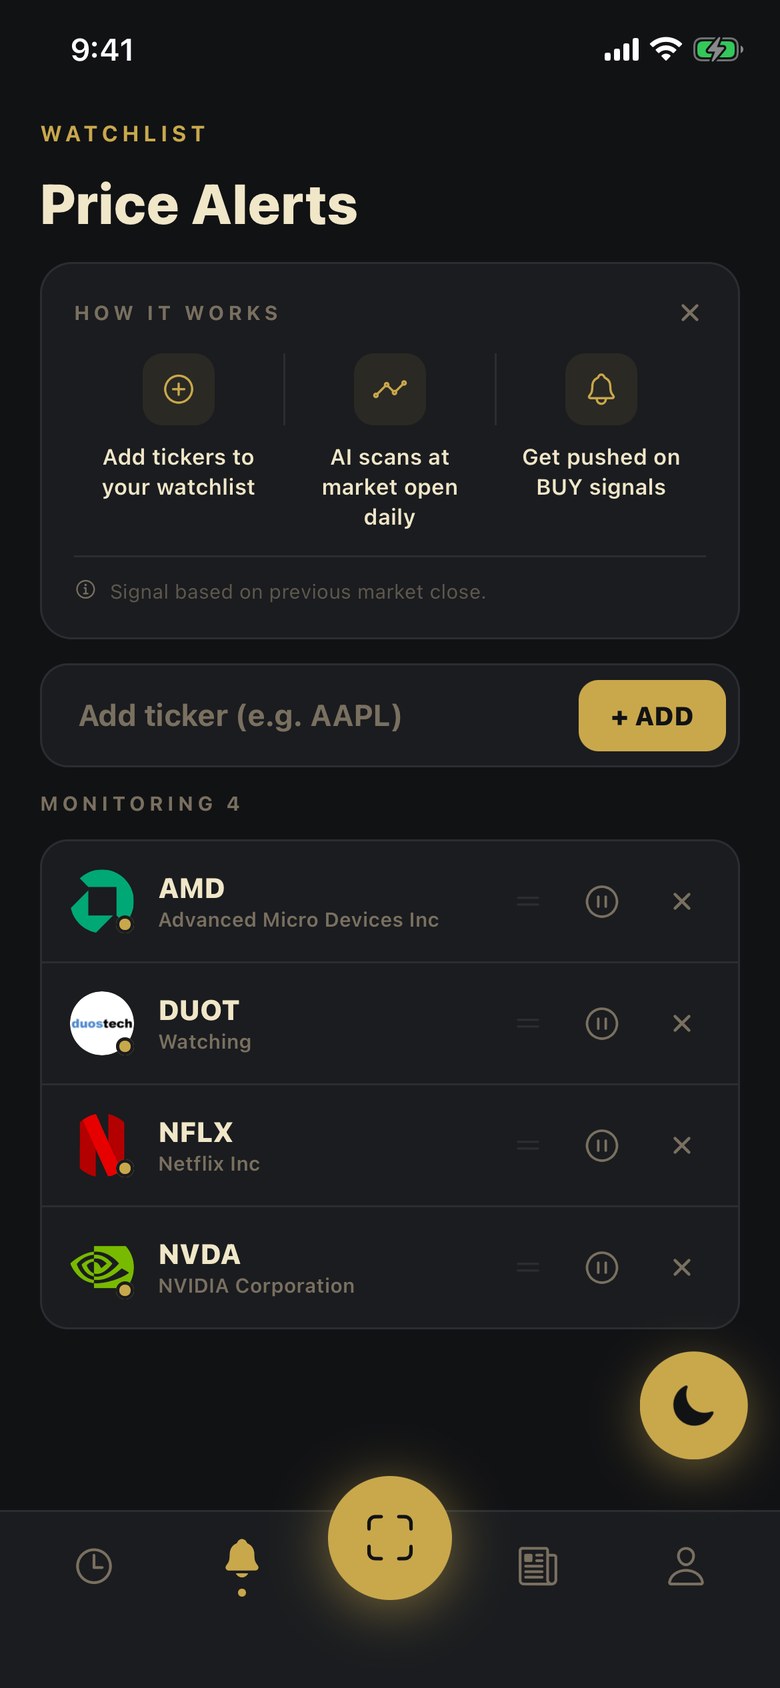
Scanned at the open.
Add the stocks you follow. Every trading morning they are scanned, and you get a push notification when a buy setup lines up.
Screening, built in.
Search any US stock by name or ticker and see whether its business and finances pass a halal (Shariah) screen. How the screening works
Automated screening guidance, not a religious ruling.
How StockBuddy AI reads a stock chart.
Screenshot the chart
Take a screenshot in TradingView, Robinhood, Webull or any broker app and upload it. Candlestick charts of US stocks and ETFs work best.
The AI runs the technical analysis
It reads the trend, candlestick patterns, support and resistance levels, moving averages, RSI, MACD and volume, then checks them against the stock's recent price data.
You get a plan
A Buy, Sell or Wait verdict with a confidence score, the entry, target and stop-loss, and the reasoning behind it, tuned to how you trade.
New to technical analysis? Start with our guide on how to read stock charts.
Built around how you trade.
Minutes to hours. Pure momentum.
Every trade closed before the bell.
Days to weeks, riding short to mid-term trends.
Months to years. Fundamentals plus technicals.
Start free.
To try it out
- 3 chart analyses
- 1 watchlist ticker
- Halal screener
- Daily market news
or $69.99 / year · 7-day free trial
- Unlimited chart analyses
- Unlimited watchlist alerts
- Full trade breakdowns
- Advanced pattern detection
- Unlimited analysis journal
US prices; shown in your local currency in the App Store. Subscriptions renew automatically unless cancelled at least 24 hours before the end of the period, and are managed in your Apple ID settings.
Questions about StockBuddy AI.
What is AI stock chart analysis?
It's technical analysis done by an AI model. StockBuddy AI looks at your chart screenshot and the stock's recent price data, identifies the trend, key price levels and indicator signals, and turns them into a trade plan you can check. Treat it as a second opinion, not a prediction.
Which indicators and patterns does it look at?
Trend direction, candlestick patterns, support and resistance, moving averages, RSI, MACD and volume. Each analysis lists the signals it found and what would invalidate the setup.
Which charts does it work with?
Screenshots from TradingView, Robinhood, Webull or any other broker or charting platform. Candlestick charts of US stocks and ETFs work best.
How does the halal stock screener work?
It checks what the company does (banks, insurance, alcohol, tobacco and gambling fail) and whether its interest-bearing debt is under about a third of its market value. Each stock comes back as compliant, not compliant or questionable. Read how the screening works.
Is this financial advice?
No. StockBuddy AI gives educational chart analysis. It can be wrong, and every trading decision is yours. Always do your own research.
What do I get for free?
Three chart analyses and one watchlist ticker, plus the halal screener and daily news. Pro unlocks unlimited analyses and alerts.
How do I cancel?
Anytime, in your Apple ID subscription settings. Billing and refunds are handled by Apple.
What happens to my charts?
Each chart is sent for analysis to generate your result, and your history is saved to your account. You can delete your account and its data from the app. See the Privacy Policy.